What are Structure Charts?
At some point in our careers, we have all used visual tools to understand how a system is organized and how its components interact. In fact, without visual tools, it is challenging to sail through system analysis and software design. One such powerful tool that is often underappreciated is the structure chart.
| Key Takeaways: |
|---|
|
This article explores structure charts in depth, their concepts, components, how they work, their advantages and limitations, and how they compare with other design tools.
What are Structure Charts?
A structure chart is a graphical representation of a system’s modular structure. It represents the software architecture, including the system’s modules, their dependencies, and the parameters passed between them.
In a structure chart, the system is depicted as a hierarchy of modules, showing how high-level functions are decomposed into lower-level subfunctions and how control and data flow between these modules.
They are top-down, hierarchical diagrams and are used in software engineering to visualize the functional decomposition of a system into smaller, manageable modules.
- What modules make up the system?
- How are these modules organized hierarchically?
- How do modules interact with each other?
In a structure chart, each module typically represents a program, subprogram, function, or procedure. The chart focuses primarily on relationships between modules rather than detailed logic. They show how a program breaks down from high-level tasks into lower-level subtasks and depict the organization, relationships, and data/control flow between these modules.
This makes structure charts especially useful during the design phase of software development.
- Components: In a structure chart, modules are represented as rectangles, connected by lines to show control flow (module interactions).
- Hierarchy: The structure chart is designed top-down, with main tasks at the top that break down into subtasks.
- Data and Control Flow: Arrows indicate data (open circles) or control parameters/flags (filled circles) passing between modules.
- Structure Elements: A structure chart has the following key elements:
- Sequence: Modules execute in a specific order.
- Selection: Module selection based on a particular condition is indicated using a diamond shape.
- Iteration: A curved arrow indicates that a module is repeated.
Historical Background and Origin of Structure Charts
Structure charts originated in the 1970s as part of the structured design movement that was a response to the growing complexity of software systems and the difficulty of maintaining monolithic programs.
Structure charts were formalized in a book titled “Structured Design: Fundamentals of a Discipline of Computer Program and Systems Design” by Edward Yourdon and Larry Constantine.
In fact, Larry Constantine is hailed as one of the most influential contributors to structured design, as he introduced concepts such as coupling and cohesion.
- High Cohesion: Each module is responsible for a single, well-defined task.
- Low Coupling: Modules have minimal dependencies on one another.
These concepts were derived from data flow diagrams (DFDs) to provide a more detailed, architectural representation of a system, mapping out input (afferent), output (efferent), and processing (transform) modules.
Structure charts were often used alongside DFDs in the past. Structure charts focused on how the system is organized, while DFDs focused on what the system does.
Later on, the hierarchy part of IBM’s HIPO (Hierarchy plus Input-Process-Output) charts, often referred to as a Vertical Table of Contents (VTOC), emerged as an early precursor to the modern structure chart.
At that time, Jensen and Tonies presented a similar notation, which they called “schematic logic”, which they noted was a modification of Michael Jackson’s work.
Structure charts prioritize functional decomposition, module, ownership, and hierarchical organization, unlike flowcharts, which emphasize sequence.
Today, structure charts remain a standard tool for designing high-level software architecture, particularly in educational contexts for teaching top-down design.
What is the Purpose of Structure Charts?
- System Visualization: Structure charts provide a high-level overview of a system’s architecture, showing the hierarchy of modules, including the main module and its submodules.
- Modular Design (Functional Decomposition): Complex programs are decomposed into smaller, functional components, or modules, that are easier to understand, design, and manage.
- Representing Relationships: Structure charts show how different modules interact, including their interaction with each other and the data/control parameters passed between them.
- Design Documentation: They provide a detailed structure of a program before coding begins, serving as a blueprint for developers. This simplifies development.
- Facilitating Maintenance: Module functions and their dependencies are clearly defined in structure charts, making it easier to update, debug, or maintain specific parts of a system without affecting others.
- Identifying Reuse: Structure charts identify functional modules that can be reused in different parts of the application.
- System design and architecture planning. Read more on system design here.
- Documentation of existing systems.
- Teaching and learning software design principles.
- Maintenance and enhancement of legacy systems.
Key Components of a Structure Chart
Structure charts visualize a software system’s top-down modular structure, showing hierarchies, dependencies, and data flow. To understand structure charts fully, it is important to examine their core components.
1. Modules
This is the fundamental building block of a structure chart.
- A function
- A procedure
- A submodule
- A method (in some interpretations)
Modules are represented as rectangles containing the module name. The top box in the structure chart is the main module, and the lower boxes are child modules.
Modules are usually named using verb-noun phrases such as Validate Login, Generate Report, or Calculate Total.
2. Module Invocation/Connection Lines
These are the solid lines connecting modules, indicating one module calls another. It represents the hierarchy and control flow.
3. Hierarchical Relationships
Structure charts are inherently hierarchical. The topmost module (root of a hierarchy) represents the overall system or main program. The next level represents submodules that handle specific tasks.
- High-level modules coordinate overall system behavior.
- Lower-level modules perform detailed processing.
Designers can see how responsibilities are distributed across the system using the hierarchical view.
4. Control Flow
The order in which modules are invoked represents the control flow. It is shown by lines connecting parent modules to child modules in a structure chart.
- The parent module (main module) calls or controls the execution of the child module.
- Control returns to the parent once the child finishes execution.
- Conditional calls (e.g., if-else logic)
- Iterative calls (e.g., loops)
5. Data Flow
Data flow is the movement or flow of data between modules. It is often represented by labeled arrows with an empty circle or a couple attached to the control lines.
- Input data is passed from one module to another.
- Output data is returned after processing.
6. Control Couples
- Flags
- Status codes
- Boolean values that determine logic paths
A control couple is represented using an arrow with a filled circle, indicating a flag or signal (e.g., “EOF”, “Valid”) that controls module logic.
Although control couples are useful, their excessive use indicates poor design.
7. Library Modules
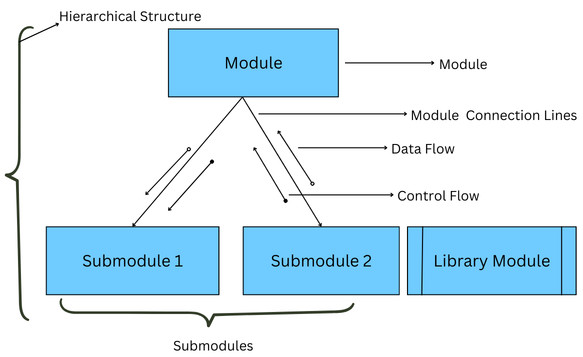
Library modules, reusable modules existing outside the main structure, are represented in structure charts using a rectangle with double vertical edges.
The following diagram shows various symbols discussed so far:
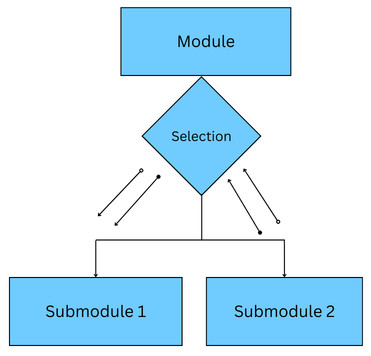
8. Selection (Diamond)
A diamond shape indicates that a module can call one of several subordinate modules (If-Then-Else logic). Depending on the condition of the diamond, a decision to branch is made. The selection in the structure chart is shown below:
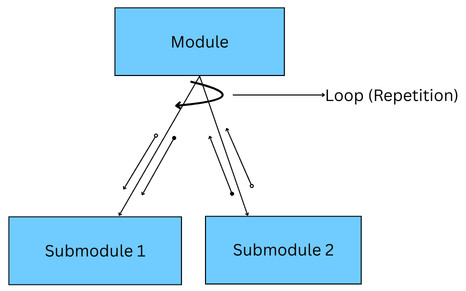
9. Repetition/Loop (Circular Arrow)
A repetition (module called repeatedly or a loop) is represented using a loop arrow around the control lines.
10. Physical Storage
All the information is stored in physical storage. In a structure chart, it is represented as a rounded rectangle.
These key components of a structure chart help partition the system into manageable, independent functional units.
What are the Types of Structure Charts?
Structure charts can be categorized based on their focus or level of detail.
1. High-Level Structure Charts
These charts provide an overview of the entire system with major modules, primary interactions, and overall system architecture.
High-level structure charts are ideal for initial design discussions, project planning, and communication with non-technical stakeholders.
2. Low-Level Structure Charts
Low-level structure charts provide details on specific modules, showing their internal structure and submodules.
They are useful for code reviews, developers implementing the system, or for detailed documentation.
3. Transaction Centered Structure Charts
In this, structure charts are organized around transactions, such as processing an order or handling a request. The flow in such charts is based on the type of transaction received.
These charts typically include a transaction center module and branches for different transaction types.
4. Transform Centered Structure Charts
This type of structure chart represents systems that receive input, perform a sequence of operations (transform the input), and generate output.
How are Structure Charts Created?
- Identify the Main Function (Root Module): Begin with the top-level main module that determines the overall purpose of the system.
- Decompose the System: Decompose the main function into submodules that are smaller, independent, or dependent, functional components, creating an “inverted tree”.
- Factor the Modules: Break down modules repeatedly into lower-level modules (subfunctions) until they represent simple, actionable functions.
- Establish Relationships: Determine the relationships between the modules and identify how data flows between them. Add arrows with symbols to represent the flow of data (data couple) and control (control couple) between modules.
- Incorporate Structures: Use appropriate notations for selection (diamond) and repetition (loop) to show control structures, and use modules for input/output and processing.
- Refine the Design: Refine the structure chart further by checking for proper indentation, ensuring child modules are on the same line, and verifying that the design covers all the functional requirements.
The above steps are performed iteratively until the system reaches an appropriate level of detail.
Example of a Structure Chart
Here is the structure chart for a general payroll generation system:
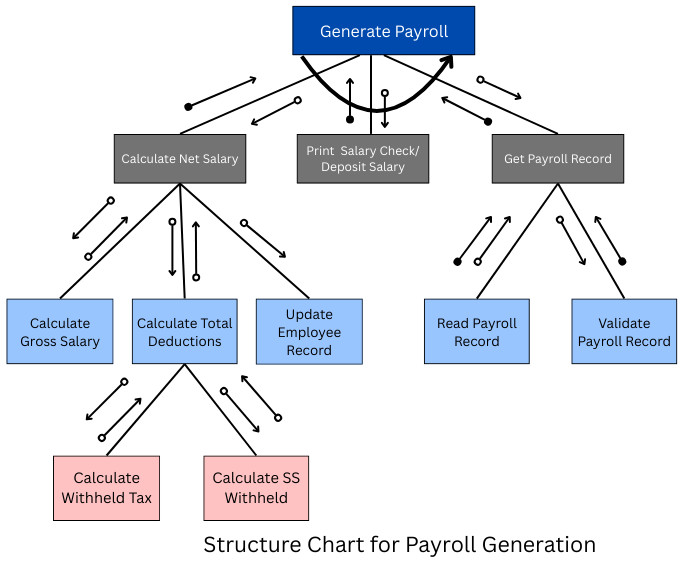
As shown in the above structure chart, generating payroll involves multiple modules and submodules. The data and control flow show the exchange of data between the modules. For example, the salary calculated is passed to the “Print Salary Check/Deposit Salary” module. Once done, control is returned to the root module, “Generate Payroll”.
Advantages of Structure Charts
- Improved Modularity: Structure charts facilitate the top-down decomposition of complex, large-scale systems that are easier to understand, implement, test, and maintain.
- Better Communication: With visual language used in structure charts, it is easier to communicate the logic and structure of the system to stakeholders, making it easy to understand at a glance.
- Easier Maintenance and Better Debugging: Well-designed modular systems represented in structure charts are easier to maintain, as changes in one module do not affect others. Identifying, tracking, fixing errors, and debugging also becomes easier.
- Early Detection of Design Problems: Using structure charts, it is easier to identify excessive coupling, overly complex modules, and poorly defined responsibilities. It saves time and cost when such issues are identified early.
- Efficient Project Planning: Structure charts map the flow of control and data parameters between modules, facilitating planning, resource allocation, and identifying potential bottlenecks.
- Simplified Visualization: Complex problems are broken down into smaller, actionable components, increasing efficiency and reducing time-consuming errors.
Limitations of Structure Charts
- Limited Representation of Logic: Structure charts do not focus on detailed logic such as algorithms, decision logic, or data transformations. As a result, they must be used alongside flowcharts or pseudocode that illustrate program logic.
- Less Suitable for Object-Oriented Design: Structure charts are not suitable in object-oriented design. They are mainly developed for procedural systems.
- Scalability Issues: If the systems to be designed are very large, the structure graphs can become too complex, difficult to maintain, and hard to read. It is challenging to maintain complexity in such cases.
- Create Rigidity: Structure charts can create rigid reporting lines that discourage collaboration and reduce organizational flexibility.
- Neglect Horizontal Relationships: They are often focused on top-down relationships, and horizontal relationships are not represented.
Structure Charts vs. Other Design Tools
Understanding how structure charts differ from other tools helps clarify their role.
Structure Charts vs. Flowcharts
The following table shows key differences between structure charts and flowcharts:
| Aspect | Structure Charts | Flowcharts |
|---|---|---|
| Purpose | It defines overall software architecture and depicts how modules are organized and interact with each other. | It documents the logical flow of control within a program, making it easier to visualize processes and troubleshoot. |
| Components | Boxes (rectangles) represent modules (functions/procedures), and lines show connections (hierarchy). | Standard symbols (ovals for start/stop, rectangles for processes, diamonds for decisions, parallelograms for I/O) are used. |
| Key Features | Shows data flow between modules (parameter passing) and control relationships (e.g., looping, selection). There is no strict sequential timeline. | Explicitly shows the execution order and the logic flow, including loops and conditional branches. |
| Advantages | Best for designing and understanding complex system structures and improving modularity. | Excellent for understanding the logic of a specific algorithm or process. |
Structure Charts vs. Data Flow Diagrams (DFDs)
The following table summarizes the differences between structure charts and DFDs:
| Aspect | Structure Charts | DFDs |
|---|---|---|
| Purpose | Structure Charts focus on the how (functional decomposition/structure). | DFDs focus on the what (flow of data). |
| Derivation | Structure charts are generally developed after the DFD. | Developed before the structure charts. |
| Components | Modules (rectangles), arrows, data couples, and control couples. | Processes, data stores, external entities, and data flows. |
| Function | Represent the software architecture and system hierarchy, showing the organization and interaction of modules. | Represent the flow of information for any process or system. |
What are the Applications of Structure Charts?
- Software Design and Planning: Structure charts are used to break down complex systems into smaller, hierarchical, manageable modules (Top-Down Design) that help with planning.
- Modeling Module Relationships: They demonstrate the intercommunication between modules, showing both the hierarchy and the flow of data/control between them.
- Documentation and Visualization: Structure charts show a visual representation of system architecture, mapping out software structure.
- Code Implementation (Pseudocode/Coding): Developers can easily translate the design into structured, modular code with the help of structure charts.
- Maintenance and Debugging: Large-scale, complex systems represented as structure charts are easier to maintain and debug as they can be understood well.
- Project Management: Projects can be managed efficiently with the help of structure charts, as they divide large projects into smaller tasks.
- Alternative to Flowcharts: Using structure charts, it is easier to distinguish software modules. They can be a good alternative to flowcharts that focus on control flow.
- Academic Learning: Structure charts are used for teaching structured programming and design principles in academia.
Conclusion
Structure charts are the foundational tools in software engineering and system design. They provide modular organizations of the system, presenting a clear, hierarchical view of the system. By using them, you can highlight the interaction between components/modules and how responsibilities are distributed across the system.
Structure charts provide clarity, modularity, and maintainability to the system. Although they may not align perfectly with modern object-oriented paradigms and do not capture detailed logic, structure charts still serve as a powerful way to visualize and communicate system structure.
Additional Resources
- What is Code Optimization?
- What Is Data Visualization?
- SQL Database Concepts: Fundamentals Every Developer Should Know
- Difference between YAML and JSON
- What is Software Architecture?
- Cohesion vs Coupling
- What are the Qualities of a Good Software?
Frequently Asked Questions (FAQs)
- Are structure charts still relevant in modern software development?
Yes, absolutely. Whether modern or traditional architectures, structure charts remain useful for understanding system organization, teaching design fundamentals, and documenting complex or legacy systems.
- How is a structure chart different from a flowchart?
A structure chart emphasizes system hierarchy and module relationships, while a flowchart represents step-by-step process logic or program flow. Structure charts focus on what modules exist rather than how execution flows.
- Can structure charts help with testing?
Yes. Using structure charts, testers understand module dependencies, identify integration points, and plan test coverage more effectively.
- What are common mistakes when creating structure charts?
While creating structure charts, users:
- Make charts too detailed or too abstract.
- Name modules poorly
- Mix process logic with structural design.
- Ignore data and control relationships.
- Who uses structure charts?
Structure charts are commonly used by:
- Developers and software architects
- Business analysts
- Testers and QA teams
- Students learning software engineering concepts.
|
|