Engineering Metrics That Drive Software Success
The software development process is complex and involves people, processes, tools, and technologies working together to deliver quality software. Engineering leaders have the daunting task of delivering quality products and services while keeping morale high and tech debt low.
They have to measure progress and ensure that the teams are not just writing code but building reliable, scalable, and manageable software. It is impossible to know whether the organization is improving or producing more activity without the right way to measure these parameters.
Software engineering metrics come to the forefront at this time.
| Key Takeaways: |
|---|
|
This article will explore the meaning and importance of essential engineering metrics and summarize different metrics used to improve the software development lifecycle (SDLC).
What are Software Engineering Metrics?
Software engineering metrics are quantitative measures. They assess the quality, efficiency, and performance of the software development process, systems, and teams.
Software engineering metrics provide valuable insights into SDLC stages, including code quality, testing effectiveness, project health, and delivery speed. They help organizations understand how effectively their development teams deliver value.
Some of the key characteristics of software metrics are:
- Simple: Metrics should be easy for all stakeholders to understand and interpret. It should be transparent and context-rich so that teams can interpret them correctly.
- Measurable: The metric must be quantifiable with numerical values. It should promote improvement and not assign blame to anyone.
- Reproducible: Metrics results should remain consistent under the same conditions. The data collection should also be automated to reduce manual effort and human error.
- Actionable: Metrics should offer insights that allow for informed decisions and improvements. They should align with business and team goals to stay relevant and actionable.
- Cost-effectiveness: The effort and resources required to collect the metric should be justified by its value. The documents should focus on long-term trends, not isolated data points.
Why Engineering Metrics Matter
In engineering, success is often measured by delivery deadlines rather than long-term outcomes, with due consideration to cost. There are too many engineering metrics to choose from. The right metrics should align with organizational objectives of delivering high-quality software quickly, sustainably, and with minimal friction.
Here are reasons why software engineering metrics are essential:
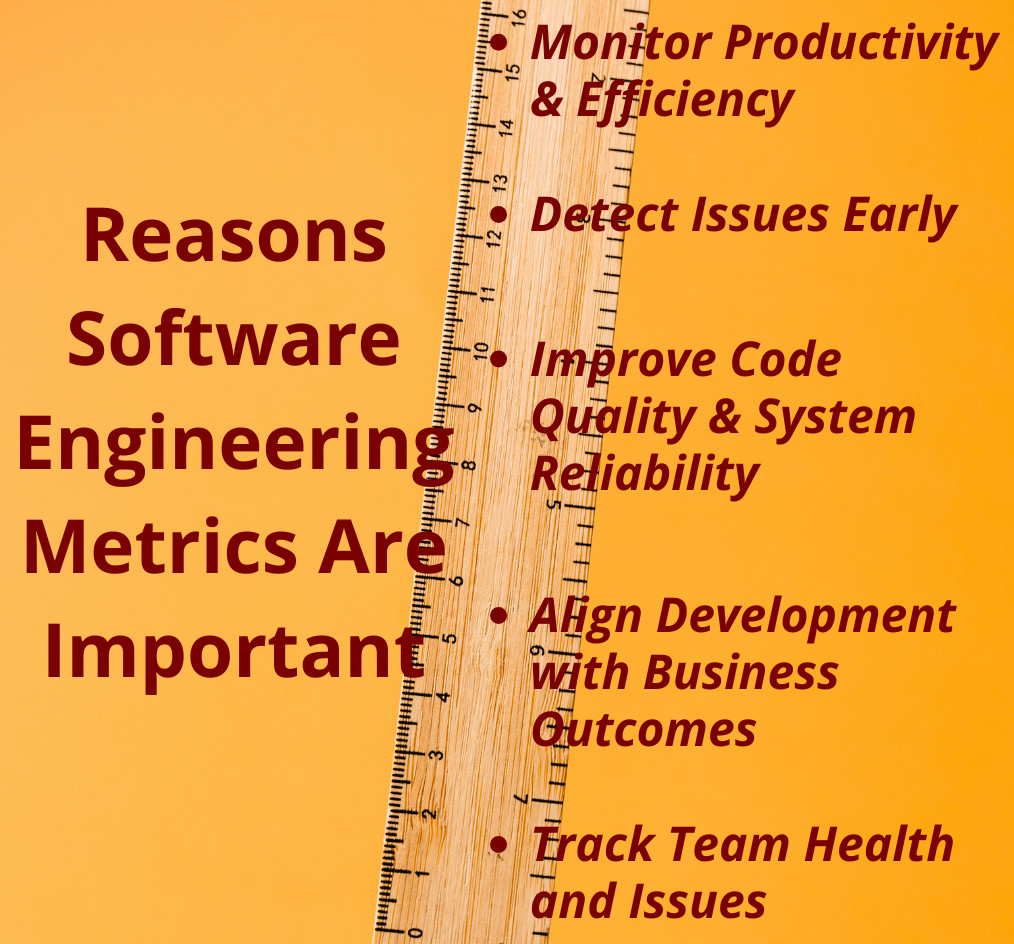
- Monitor Productivity and Efficiency: Metrics identify areas where teams are improving or lacking. This helps monitor team productivity and development efficiency.
- Detect Issues Early: Metrics remove the guesswork and help spot bugs, performance issues, or process inefficiencies before they escalate. Initiatives are prioritized based on evidence.
- Improve Code Quality and System Reliability: With metrics, teams can measure progress, identify inefficiencies, and track test coverage and technical debt. Code health can often be maintained by refactoring.
- Align Development with Business Outcomes: Engineering metrics checks that the engineering work supports key company goals. Stakeholders are shown how teams perform and whether efforts align with business requirements.
- Track Team Health and Issues: Metrics reward collaboration and quality by monitoring lead time, rework, and responsiveness to support a sustainable pace.
Engineering Metrics Categorization
- How efficiently the team ships software systems.
- How often do quality issues pop up in the applications?
- How collaboration plays out across the team working on a software system.
- How does all of that change over time and affect the organization?
-
Velocity and Flow: This category of metrics reveals how smoothly and fast the work moves from idea to delivery. It tracks the efficiency and effectiveness of software development processes.Examples of metrics in this category are:
- Lead Time for Changes
- Deployment Frequency
- Cycle Time
- Work in Progress (WIP)
-
Quality: The quality category of engineering metrics helps to determine how reliable, stable, and maintainable the product is. It also helps to track problems early and fix them before they reach production.Examples of Quality metrics:
- Change Failure Rate
- Mean Time to Recovery (MTTR)
- Defect Density
- Escaped Defects
-
Productivity and Efficiency: This category deals with how effectively resources are used. It focuses on utilizing resources, including developers, to ensure the quality and performance of the software product.Metrics under this category are:
- Code Churn
- Sprint burndown
- Release burndown
- Technical Debt Ratio
- Resource Utilization
- Pull Request (PR) Review Time
-
Collaboration and Developer Experience: This classification of engineering metrics determines how healthy the engineering culture is, including review depth and response time. The metrics in this category measure the impact of team dynamics.Examples of collaboration and developer experience metrics are:
- Developer Satisfaction
- Knowledge Sharing
- Bus Factor
- Onboarding Efficiency
We will next dive into the essential engineering metrics within these categories.
Essential Engineering Metrics for Software Engineering Teams
These metrics measure how quickly teams can deliver value from idea to production.
1. Lead Time for Changes
Lead time for changes measures the time it takes for a code change to move from commit to production deployment.
A shorter lead time indicates faster feedback loops and greater agility. On the other hand, longer lead times mean bottlenecks in testing, code reviews, or deployment pipelines.
Automating CI/CD pipelines, encouraging smaller pull requests, and streamlining approval workflows can improve lead times.
2. Deployment Frequency
Deployment Frequency metrics measure how often the code is released into production.
Higher deployment frequency shows that the value is delivered continuously and risky ‘big bang’ releases are avoided.
Adopting feature flags, trunk-based development, and automating release pipelines are some ways to improve deployment frequency.
3. Cycle Time
The time taken from when work starts on a task (e.g., when coding begins) until it is completed and delivered is the cycle time.
Shorter cycle times indicate teams respond faster to customer requests. Longer cycle times indicate inefficiencies in development or testing processes.
Cycle times can be improved by breaking work into smaller units, reducing context switching, and optimizing workflow stages.
4. Work in Progress (WIP)
WIP metrics measure the number of tasks currently in progress at any given time.
A WIP that is too significant causes delays, reduced quality, and context switching. On the other hand, a healthy WIP encourages focus and completion.
Implementing Kanban practices and enforcing WIP limits can enhance throughput.
5. Change Failure Rate
Change failure rate is the percentage of deployments that fail and require a hotfix, a rollback, or a patch.
If change failure rates are high, it indicates poor testing, a lack of automation, or risky release practices.
Measures like strengthening automated testing, implementing progressive rollouts, and investing in observability are recommended to improve change failure rates.
6. Mean Time to Recovery (MTTR)
MTTR is the average time taken to restore service after a production incident.
Incidents are inevitable in the software industry. However, the speed of recovery from these incidents determines the customer impact. A low MTTR indicates strong monitoring and incident response.
MTTR can be improved by automating incident detection, practicing blameless postmortems, and empowering teams to deploy quick fixes.
7. Defect Density
The number of bugs found per thousand lines of code or per feature delivered is called the defect density.
Defect density tracks the overall quality of the codebase, and high defect density signals rushed development or weak testing.
Improve defect density by emphasizing test-driven development (TDD), static code analysis, and peer reviews.
8. Escaped Defects
Escaped defects are the bugs that reach production and are reported by end users.
One can determine the effectiveness of pre-release testing by examining escaped defects. The higher the number of escaped defects, the less effective the pre-release testing.
To prevent or lessen the escaped defects, QA processes should be improved, automated regression suites added, and canary deployments used.
9. Code Churn
Code Churn is the percentage of a developer’s code that is rewritten or deleted shortly after being written.
While some code churn is normal, a high value may suggest unclear requirements, poor collaboration, or technical debt.
Developers can reduce code churn by investing in upfront planning, pair programming, and more precise specifications.
10. Sprint Burndown
A sprint burndown measures how much work is left to be done before a sprint ends.
It indicates progress towards a specific goal, and engineers can track the rate at which they must burn down story points to complete the sprint on time.
A sprint burndown helps developers discover unplanned tasks when work keeps piling or is stagnant instead of being reduced. It is also used for quick diagnosis and resolution of performance problems.
11. Release Burndown
Release burndown determines how much work needs to be done before releasing a product.
The release burndown metric is used for estimating releases in real time and helps developers keep track of how their developmental changes affect the release date.
Unlike sprint burndown, release burndown measures the entire project’s remaining work.
12. Technical Debt Ratio
The technical debt ratio is the ratio of the cost to fix issues later versus fixing them now.
High technical debt indicates slow future development with increased maintenance costs.
Code should be refactored often, and clean coding standards should be adopted to improve technical debt. Using static analysis tools helps measure technical debt.
13. Resource Utilization
This is the percentage of engineering capacity dedicated to feature development versus bug fixes, maintenance, or firefighting.
When more time is spent on feature development, resource utilization is said to be optimal. Too much time spent on bug fixes indicates a weak foundation, and too little time on bug fixing suggests underinvestment in reliability.
14. Pull Request (PR) Review Time
PR review time is the average time to review and approve code changes.
Review time should not be too long, as it delays deployments and frustrates developers. PR review time can be improved by defining SLAs for reviews, encouraging smaller PRs, and using automated code review tools.
15. Developer Satisfaction
Developer satisfaction is the survey or feedback score that measures engineers’ happiness with the tools, processes, and culture.
Satisfied and happy developers are more productive and less likely to switch jobs. Using modern tools, reducing unnecessary meetings, and investing in learning opportunities can enhance developer satisfaction.
16. Knowledge Sharing
Knowledge sharing is measured through contributions to documentation, mentorship, and collaboration activities.
Knowledge sharing prevents silos and ensures continuity when team members leave. Knowledge sharing can be enhanced by encouraging pair programming, maintaining wikis, and rewarding documentation efforts.
17. Bus Factor
Bus factor value is the number of people who must leave before a project is at risk due to knowledge loss.
A low bus factor indicates too much dependence on specific individuals. Rotating responsibilities, cross-training team members, and enforcing documentation practices are some ways to improve bus factor.
18. Onboarding Efficiency
Onboarding efficiency measures the time it takes for new developers to make their first meaningful contribution to the project.
Efficient onboarding means the organization possesses good documentation, tooling, and mentoring. A structured onboarding process, guides, automated environment setup, and buddy systems can improve onboarding efficiency.
19. Test and Code Coverage Percentage
Test and code coverage percentage is the extent to which the codebase is covered by automated tests, indicating code completeness.
A higher percentage indicates code stability, which doesn’t guarantee bug-free software.
Automating the test cases of the entire codebase can improve the code and test coverage percentage.
20. Cyclomatic Complexity
This measures the number of independent paths through the code, helping assess its maintainability.
Lower cyclomatic complexity means simpler, easier-to-test code, whereas higher values require refactoring.
Best Practices for Using Engineering Metrics
- Avoid Vanity Metrics: Avoid using metrics that don’t add value. A measure like “lines of code written” is unsuitable since good engineering practices involve deleting unnecessary code.
- Use Metrics as Guides, Not Weapons: Use metrics to help improve the development process and not punish developers. Misuse of metrics erodes trust.
- Balance Speed and Quality: Don’t optimize one factor at the expense of another. Fast deployment with a high failure rate is not productive.
- Visualize Trends Over Time: Track metrics as trends over time. A trend reveals whether the team is improving instead of a single data that says little.
- Tailor Metrics to Your Context: Different organizations have different focuses, so tailor metrics to your organizational context. For example, if you are a startup, speed is the priority.
- Connect Metrics to Business Outcomes: Metrics should tie to customer satisfaction, risk reduction, or revenue growth. These are the business outcomes every metric should connect to.
Benefits of Engineering Metrics
- Promote Decision-Making: metrics help data-driven engineers determine how to improve the product to promote customer satisfaction and a healthy environment.
- Monitor Progress: Engineers use metrics to measure the time it takes to reach different milestones. They then provide stakeholders with realistic timelines.
- Measure Code Quality: Specific metrics like code coverage can measure code quality and help engineers improve their processes to meet code quality standards.
- Improve Visibility: Engineering metrics provide insight into how well the team meets productivity goals.
- Nurture Continuous Improvement: Tracking engineering metrics can determine whether changes make a difference.
- Promote Efficiency and Cost-Effective Solutions: Engineering metrics help engineers track cost and efficiency, build solutions that give them an advantage in the market, and protect their organization’s margins.
Common Pitfalls When Tracking Metrics
- Over-Measurement: Tracking too many metrics or focusing too heavily on metrics dilutes focus and lowers team members’ overall productivity.
- Misinterpretation: Misinterpreted data leads to misguided decisions and ineffective changes due to a lack of context.
- Lagging vs. Leading Indicators: The lagging or leading indicators (e.g., defect density) show problems only after they occur.
- Ignoring Qualitative Feedback: Metrics may ignore qualitative aspects like team morale or developer creativity.
- Incomplete Data: Data that is inaccurate or inconsistent produces unreliable insights.
- Difficulty in Quantifying: Some valuable contributions, like mentorship or architectural planning, are hard to quantify.
Emerging Trends in Engineering Metrics
- DORA Metrics: Google’s DevOps Research and Assessment (DORA) metrics, consisting of lead time, deployment frequency, MTTR, and change failure rate, are fast becoming the industry standard.
- SPACE Framework: A model from Microsoft Research measures Satisfaction, Performance, Activity, Communication, and Efficiency.
- AI-driven Insights: Metrics use AI-driven insights to analyze codebases, PRs, and developer workflows to predict bottlenecks and suggest improvements.
- Value Stream Metrics: Companies are extending the scope of measurement from measuring engineering outputs to measuring the entire value stream from idea to customer impact.
Conclusion
When used thoughtfully, engineering metrics are powerful tools for improving software development. Organizations focusing on velocity, quantity, productivity, and developer experience create scores that drive sustainable growth.
The essential engineering metrics covered here form the foundation of a healthy engineering practice. The ultimate goal of metrics is not just faster releases or cleaner code but to deliver reliable value to customers and build a resilient, motivated engineering team.
The real magic of engineering metrics lies in how they are used to learn, improve, and foster a culture of trust and excellence.
|
|