What is a HIPO (Hierarchical Input Process Output) Diagram?
Ever looked at a flowchart and wondered what it is trying to communicate? While it tells you the decisions, it does little to no justice in explaining the hierarchy or structure. This brings us to HIPO diagrams, a vintage tool to depict such use cases.
HIPO stands as a quiet relic from traditional software planning days. Before modern UML diagrams and agile boards ruled workflows, this method offered clarity through layers. Some stumble on it now while digging into system breakdowns. Curious learners, developers mapping logic, document writers untangling functions – each finds their way here. Its structure pulls apart inputs, steps, and outputs.
| Key Takeaways: |
|---|
|
Let’s dive deeper into HIPO and understand how this diagram helps us understand structure and inputs/outputs so systematically. We’ll also see if it’s relevant in today’s era.
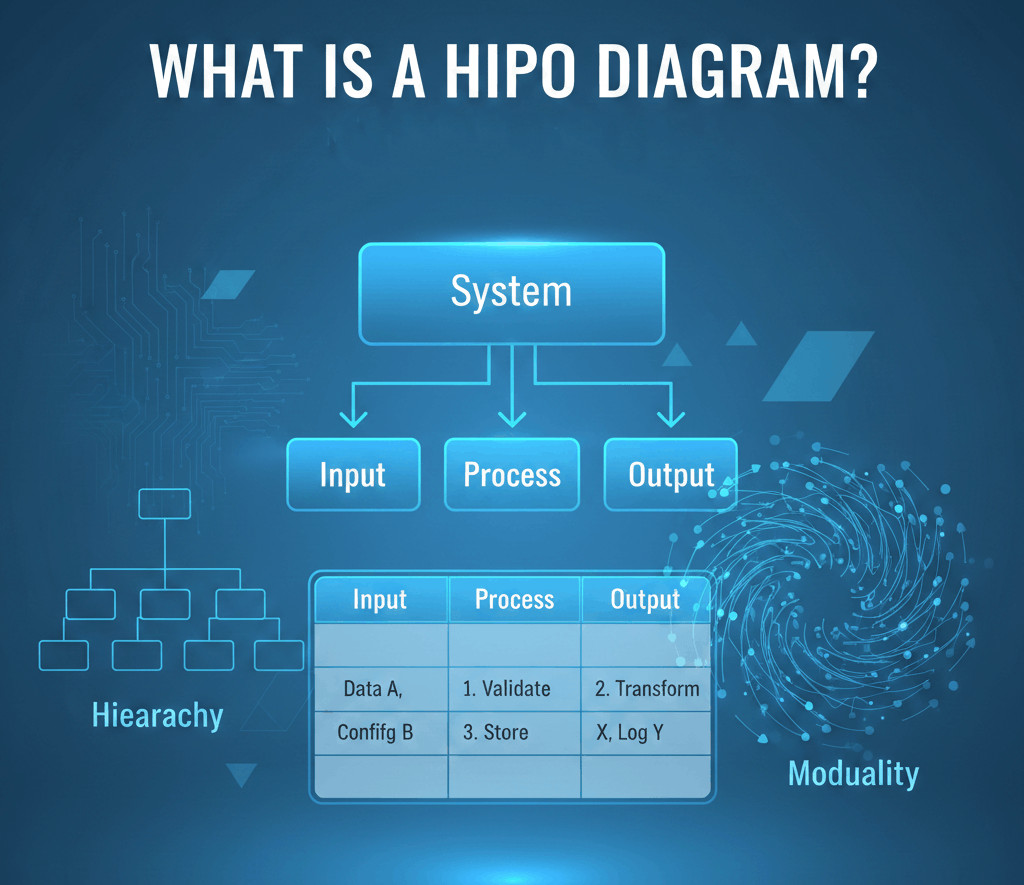
What is a HIPO (Hierarchical Input Process Output) Diagram?
HIPO stands for Hierarchical Input Process Output.
At its core, it’s a documentation and design method used to describe how a system works by splitting it into smaller, manageable parts. What you get is clarity through structure. Instead of facing a tangled, monolithic mess, each chunk stands on its own. Details become visible only when separated. The method helps you build insight slowly.
A HIPO diagram does two main things:
- It shows the hierarchy of system functions (top-down structure).
- Each piece gets broken down by showing inputs, how they’re handled, then results – using IPO diagrams to clarify roles.
HIPO answers the question “What are the parts of this system, and what does each part take in and produce?”
Why People Still Consider the HIPO Diagram
People usually skip looking up HIPO. And yet, HIPO can benefit a lot from it.
- Their project is too big to explain in one go.
- They’re writing software documentation.
- They’re studying software engineering or system analysis.
- They need a simple way to break down logic.
- They’re stuck explaining a system to non-technical stakeholders.
The Core Idea Behind the HIPO Model
- Look at the big picture first, and then split it into pieces.
- Next comes a breakdown showing how every piece works.
That’s it.
- Finding your way begins at the main function.
- You split it into subfunctions.
- Break it down further every time one part still feels unclear.
After splitting it, each part gets documented with an IPO chart. Each segment is then captured through an IPO layout. Once divided, every portion shows up in an IPO format.
- A design tool and
- A documentation tool
People at big companies such as IBM leaned on it heavily during the 70s and into the 80s.
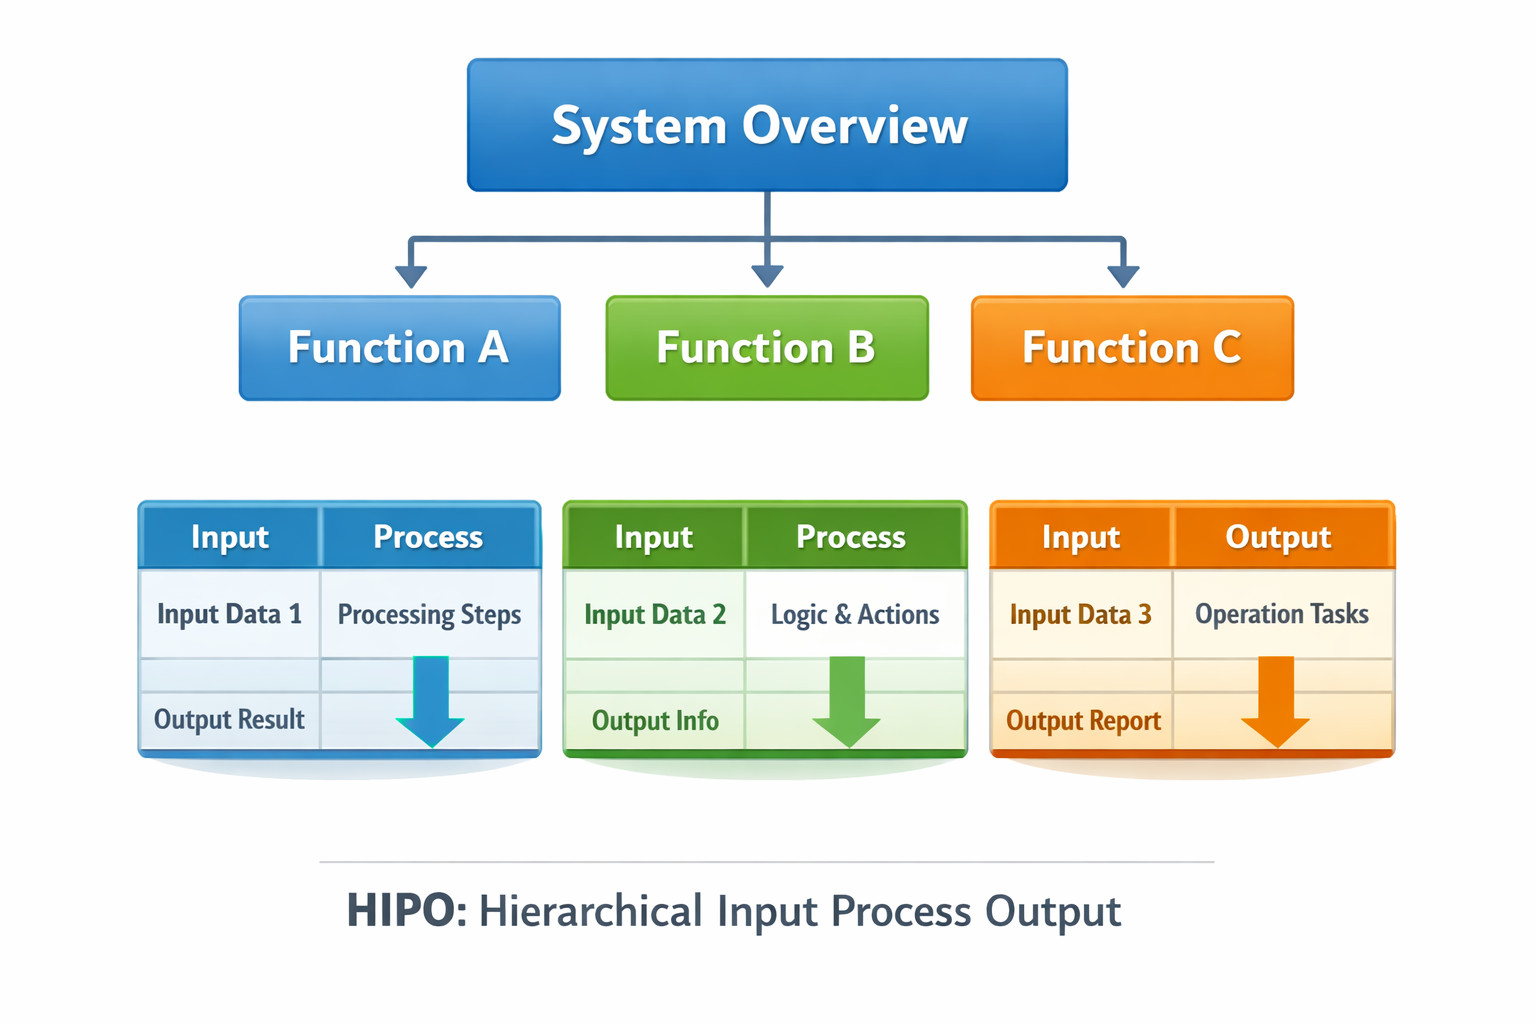
Main Components of a HIPO Diagram
A full HIPO setup includes two parts. One part shows the big picture, while the other breaks down each step into smaller actions.
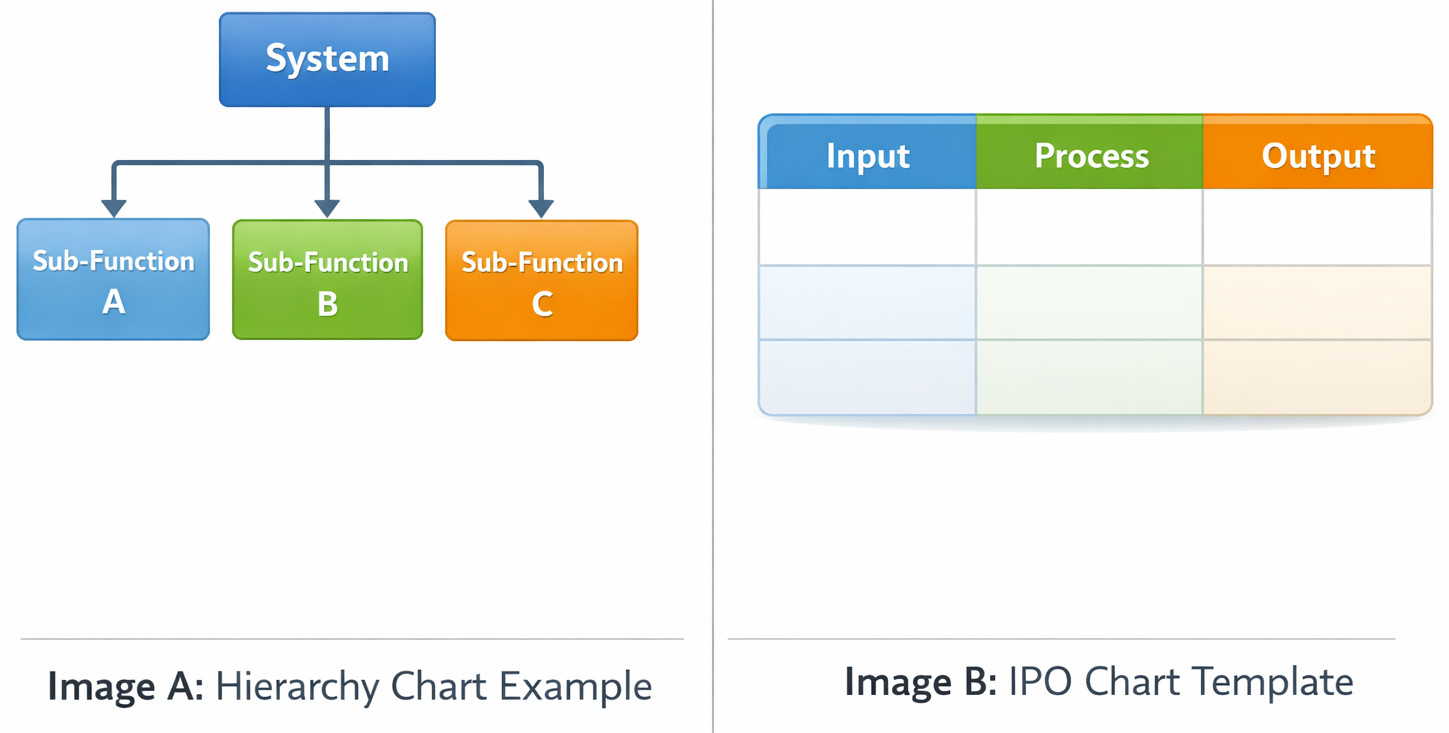
1. Hierarchy Chart in HIPO Diagram
This is the top-level view.
- At the top sits the main system.
- Below it are the major functions.
- Further below that are smaller subfunctions.
And so on…
- What does the system consist of?
- How are functions grouped?
- On what does everything hinge?
Skipping details on how data flows is by design.
On paper, it seems fine. Yet once used, folks tend to treat it like a step-by-step map instead of what it is, which sparks the mixed feelings.
Hierarchy charts are about structure, not flow.
2. IPO Charts (Input Process Output)
Start each level of the function ladder by drafting an IPO chart. At every stage, one of these charts gets made. Moving up or down, the pattern holds true – each step includes a layout showing inputs, processes, and outputs.
- Input – what data comes in
- Process – what happens to it
- Output – what comes out
That’s it. No loops. No conditions. No arrows everywhere. Just a clear explanation of responsibility.
When clarity’s missing in the IPO chart, the entire HIPO setup loses its value. Without precise steps shown early, confusion grows fast down the line.
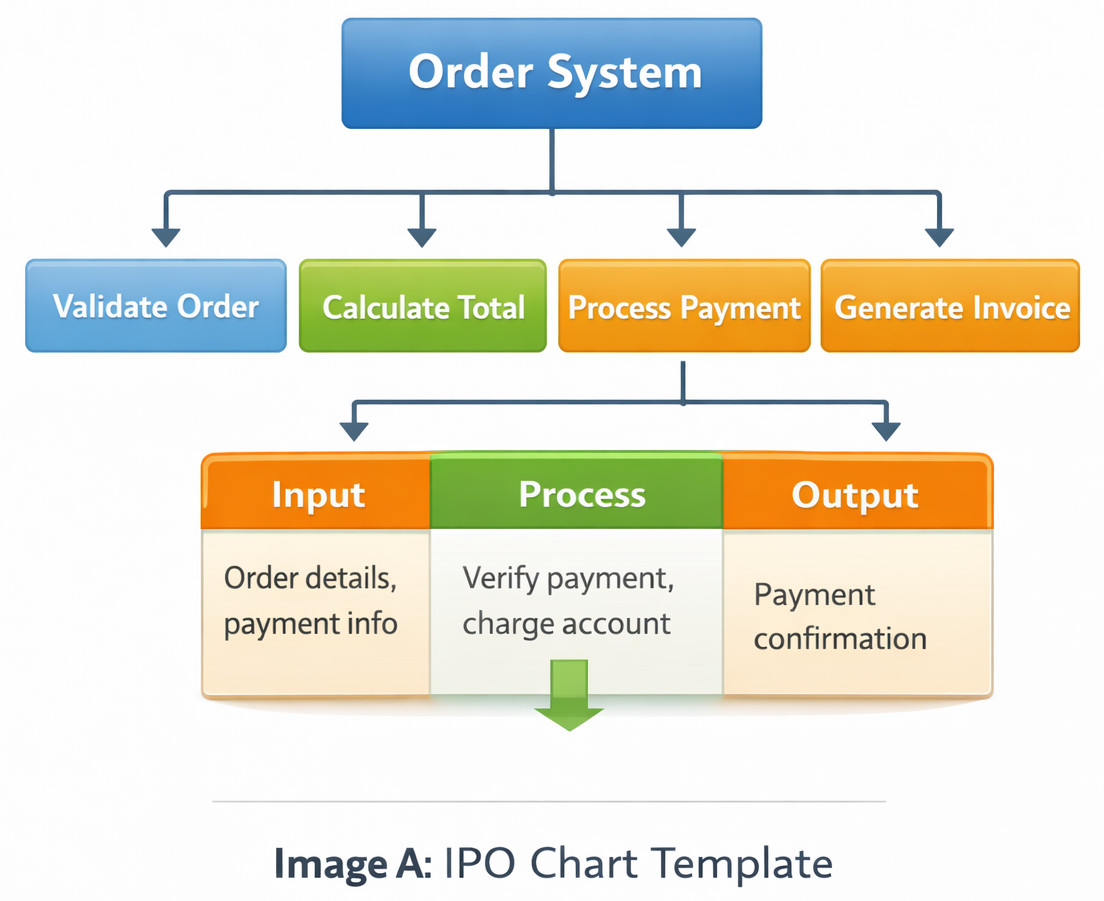
Example of a HIPO Diagram (Simple Explanation)
Imagine building a way for people to place orders through the web.
Hierarchy chart
- Order System
- Validate Order
- Calculate Total
- Process Payment
- Generate Invoice
IPO Chart Process Payment
- Input: Order details, payment info
- Process: Verify payment, charge account
- Output: Payment confirmation
Just plain instructions that are easy on the eyes and mind.
Having such a pictorial representation sparks thoughts within the team. A manager might get the idea. Someone building software might put this into practice. It could be handled by a developer during setup. Tester builds tests based on their understanding of the diagram.
Here lives the quiet strength behind HIPO.
How to Draw a HIPO Diagram (Step-by-Step)
1.Define the main system goal
How should the system behave?
What tasks must it handle?
2.Break it into major functions
Built on top of earlier pieces, these form the opening rung in the hierarchy layout.
3.Decompose further
Break it down more every time a piece still seems too big to describe easily.
4.Create IPO charts for each module
Focus on clarity, not technical perfection.
5.Review with someone non-technical
Got it across? Then you got it done.
HIPO Diagram in Software Engineering
- System analysis
- High-level design
- Documentation
Back when UML wasn’t around, HIPO linked how businesses thought with how programs worked.
- Legacy system documentation
- Training new team members
- Explaining architecture without overwhelming detail
- Student projects
- Early-stage planning
Modern tools still hold their place. HIPO acts as a thinking aid.
HIPO Diagram vs Flowchart
This comparison comes up a lot.
| HIPO Diagram | Flowchart |
|---|---|
| Shows structure | Shows flow |
| Top-down | Step-by-step |
| Focus on functions | Focus on logic |
| Good for documentation | Good for process visualization |
People often try to use HIPO like a flowchart. That’s when it fails. HIPO is not about how things happen; it’s about what exists and what its specific job is.
HIPO Diagram vs DFD (Data Flow Diagram)
Another common confusion.
| HIPO Diagram | DFD |
|---|---|
| Functional hierarchy | Data movement |
| Responsibility | Data storage |
| Modular structure | Data interactions |
DFDs are meant for data (how it is stored, moved, and who’s interacting with it), whereas HIPO documents responsibilities (which module owns a task and specific inputs/outputs for the function). When actual work begins, picking just a single option tends to fall apart. Teams run into trouble fast. These work better side by side than apart.
Advantages of Using a HIPO Diagram
- Forces clear thinking: If you can’t write the IPO, you don’t understand the module.
- Easy for non-technical readers: Teams in charge stick with HIPO since it feels like everyday talk.
- Great for documentation: Long after it was built, people are able to grasp how the system works.
- Supports modular design: A single job lives by itself.
- Simple to create: A whiteboard does the job just right – no extra tools required.
Disadvantages of the HIPO Diagram
- No real flow representation: You still need flowcharts or DFDs.
- Ends up huge sometimes: When big setups come into play, IPO charts pile up documentation overload.
- Feels outdated to modern teams: Developers used to UML might push back at first.
- Easy to oversimplify: On paper, it seems fine – yet once applied, tangled reasoning tends to hide within unclear IPO outlines.
Is the HIPO Diagram Still Used Today?
As we said earlier, HIPO diagrams are vintage at this point. Most teams have swapped HIPO for UML (Unified Modeling Language) or Mermaid.js, which are more flexible. They exist, and you’ll still see them around; they aren’t go-tos for modern teams.
- Universities
- Government projects
- Legacy system documentation
- Highly regulated industries
- Training material
- Exam syllabi
When Should You Use a HIPO Diagram?
- You need to explain a system clearly.
- One day, someone else will hold what you documented long after everyone moves on.
- You’re working with mixed technical/non-technical audiences.
- You want to understand a messy system.
- You’re teaching or learning system design.
When Not to Use a HIPO Diagram?
- You need a detailed data flow.
- Running it shows how it behaves.
- You’re designing real-time systems.
- You need executable models.
Common Mistakes Teams Make When Using HIPO Diagrams
1. Treating HIPO as a One-Time Deliverable
This is a big problem. Out of sight, that HIPO chart sits untouched. On the contrary, HIPO charts should be treated like a living document. If your code evolves but your source of truth stays stuck in month 1, the diagram becomes a liability. New engineers will follow the map only to find elements have been moved, leading to massive confusion during onboarding.
2. Writing Vague IPO Charts
A good IPO chart should be specific enough that a developer could almost write the function headers just by looking at it. If your process column doesn’t explain the transformation, how A actually becomes B, you haven’t documented the system; you’ve just labeled the parts.
3. Over-Decomposing the System
There is such a thing as “too much detail”! Some teams keep breaking modules down until they are documenting individual lines of code or basic math operations. If your hierarchy chart looks like an infinite family tree, you’ve lost the Bird’s Eye View that makes HIPO valuable. The goal is to map functional areas, not to count every tiny detail.
4. Using HIPO Instead of Other Diagrams (Not Alongside Them)
- DFDs for data
- Flowcharts for logic
- UML for behavior
Think of HIPO as the map of the house, and a Flowchart as the directions on how to walk through it.
5. Forgetting the Audience
A HIPO diagram is a communication tool. If it’s so technical that the Product Manager can’t understand the hierarchy, or so high-level that the Lead Dev can’t see the data flow, it fails. You have to strike a balance. The hierarchy chart should be readable by anyone, while the IPO charts should provide the information the developers need to actually build the thing.
Should You Learn HIPO?
HIPO isn’t the most modern framework, but if you want to be a better architect, the answer is a resounding yes.
- It cures “code first, think later” syndrome. HIPO forces you to slow down. By defining your Inputs and Outputs before you ever touch a keyboard, you catch architectural flaws when they cost nothing to fix.
- It’s the ultimate debugging map. When your application hits production, and in case you find a bug, the hierarchy and output charts show you exactly what to expect where. In fact, if the process is documented well in the chart, you can even see where the logic drifted away.
- It offers a good way to scale up without stressing your mind. As systems get bigger, they become impossible to hold in your head all at once. With everything documented in HIPO, you can zoom in and out of modules, add new ones, update them, and still have the latest version of the system with you in a safe place.
- Design cleaner systems
- Write clearer documentation
- Explain complex things better
- Recognize when complexity is fake
Is HIPO Worth It?
HIPO isn’t exciting. It’s not modern. Fancy tools aren’t part of it. Yet here lies a quiet lesson, one not often seen: how to think clearly about complex systems.
That is the reason people keep looking for it. It’s never about needing the drawing. That’s not what drives them. It’s the clarity that HIPO offers. Clear thinking shows up as clean code.
Additional Resources
- What is Code Optimization?
- What is Software Architecture?
- How to Write a Good SRS (Software Requirements Specification): A Complete Guide with Examples
- Cohesion vs Coupling
- What are the Qualities of a Good Software?
- How to Write Scalable Code: Best Practices for Maintainable Software
FAQs
What is the difference between a HIPO diagram and an IPO chart?
An IPO chart defines a single function by listing its input, process, and output. A HIPO diagram goes one step further by organizing multiple IPO charts into a hierarchy. In simple terms, IPO explains one function; HIPO explains how many functions fit together.
Is the HIPO diagram still relevant in modern software development?
Yes, but not in the way most people expect. HIPO isn’t popularly used as a formal diagram anymore, but the thinking behind it is still very relevant. Teams often use HIPO-style breakdowns during early design discussions, documentation, or onboarding, just without calling it HIPO.
When should you avoid using a HIPO diagram?
You should avoid HIPO when you need to model detailed data flows, real-time interactions, or system behavior. This sounds good on paper, but in practice, HIPO doesn’t handle complex logic well. In those cases, flowcharts, DFDs, or UML diagrams are a better fit.
|
|